To fix INP in WordPress, free up the browser’s main thread at the moment a visitor clicks, taps or types. Google rates Interaction to Next Paint as good at 200 milliseconds or less, and poor above 500 ms.
The usual culprits are chat widgets, tag managers, plugin scripts loaded everywhere and heavy builder markup. Below is the order to fix them in, and the checks that prove each fix worked.
⚡ Quick answer
- Best for: WordPress sites where PageSpeed Insights or Search Console shows INP as Needs improvement (over 200 ms) or Poor (over 500 ms) on mobile.
- Skip if: your field INP is already under 200 ms at the 75th percentile. A red Total Blocking Time in a lab test alone is not an INP failure.
- Time needed: one to three hours to find and fix the worst interaction, then up to 28 days for field data to catch up.
- Our call: cut third-party JavaScript first, unload plugin scripts per page second, and only then touch theme or builder markup.
Contents
- What is INP and what is a good INP score?
- What you need before you start
- Step 1: Confirm the INP problem in field data
- Step 2: Find the slow interaction in Chrome DevTools
- Step 3: Cut and delay third-party JavaScript
- Step 4: Load plugin scripts only where they are used
- Step 5: Fix INP on Elementor sites
- Step 6: Break up long tasks in your own code
- How do you check the INP fix worked?
- What breaks and how to undo it
- Frequently Asked Questions
- Which INP fix should you do first?
What is INP and what is a good INP score?
Interaction to Next Paint measures the delay between a user action and the next frame the browser paints in response. It replaced First Input Delay as a Core Web Vital on 12 March 2024.
INP watches every click, tap and key press during a visit. Hovering, scrolling and zooming are not counted. The reported value is roughly the worst interaction, with one outlier ignored for every 50 interactions on busy pages.
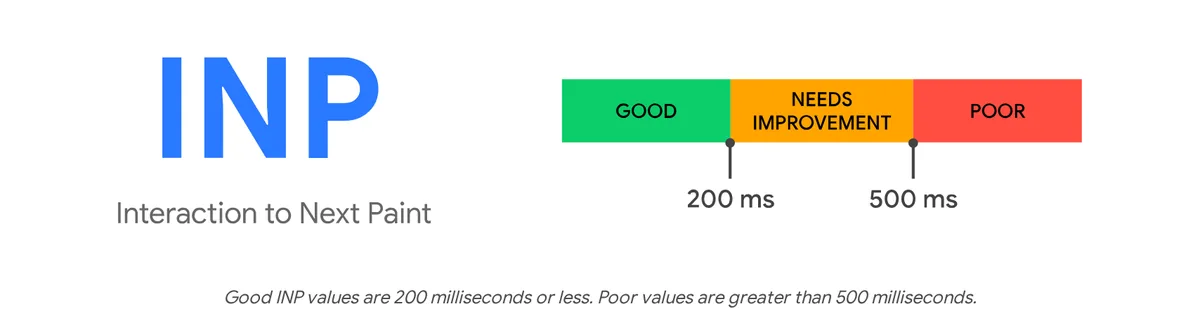
| INP at the 75th percentile | Rating | What it means for a WordPress site |
|---|---|---|
| 0–200 ms | Good | Menus, accordions and forms respond on the next frame for most visitors |
| 201–500 ms | Needs improvement | Taps feel sticky on mid-range phones; usually one or two heavy scripts |
| Over 500 ms | Poor | Visitors tap twice, menus open and close, forms feel broken |
Every interaction has three parts, and the fix depends on which part is slow. Learn these three names; the rest of this guide uses them.
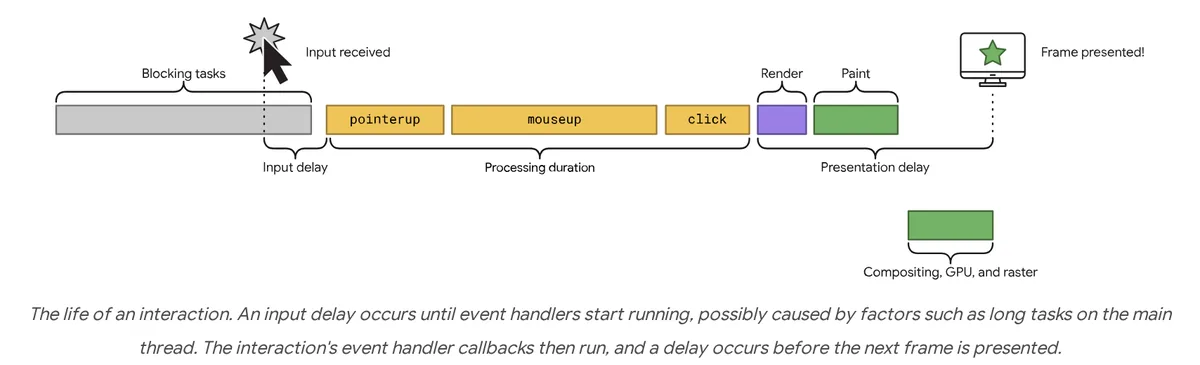
- Input delay: the click waits because the main thread is busy with something else, often a script still loading or a third-party timer.
- Processing duration: the event handlers themselves run too long, such as a menu script or an analytics click listener.
- Presentation delay: the browser needs too long to recalculate styles and repaint, usually because the page’s DOM is huge.
If you need the wider picture with LCP and CLS, start with our guide on how to pass Core Web Vitals in WordPress. This article goes deep on INP only.
What you need before you start
- A public URL with traffic. Field INP comes from real Chrome visits. A brand-new page has no data yet.
- Chrome on a desktop. DevTools ships with it; no extension needed.
- Administrator access to install or configure a performance plugin, plus FTP or a snippets plugin for code changes.
- A staging copy or a fresh backup. Delaying and unloading scripts is the most common way to break a menu or a form.
- WordPress 6.3 or later if you want to use the core
deferstrategy shown in Step 4.
New to speed work? Read our complete guide to speeding up a WordPress website first. Caching and hosting fix LCP; INP needs the JavaScript work below.
Common mistake: testing only the homepage. INP failures in Search Console usually come from a template, such as single posts with a chat bubble or product pages with a gallery.
Step 1: Confirm the INP problem in field data
Start with real-user data, not a lab score. Open PageSpeed Insights, paste the failing URL and read the top section about real users. That block is CrUX field data from the last 28 days.
If the URL has too little traffic, PageSpeed Insights falls back to origin-level data for the whole domain. In Search Console, the Core Web Vitals report groups failing URLs by template, which tells you where to look.
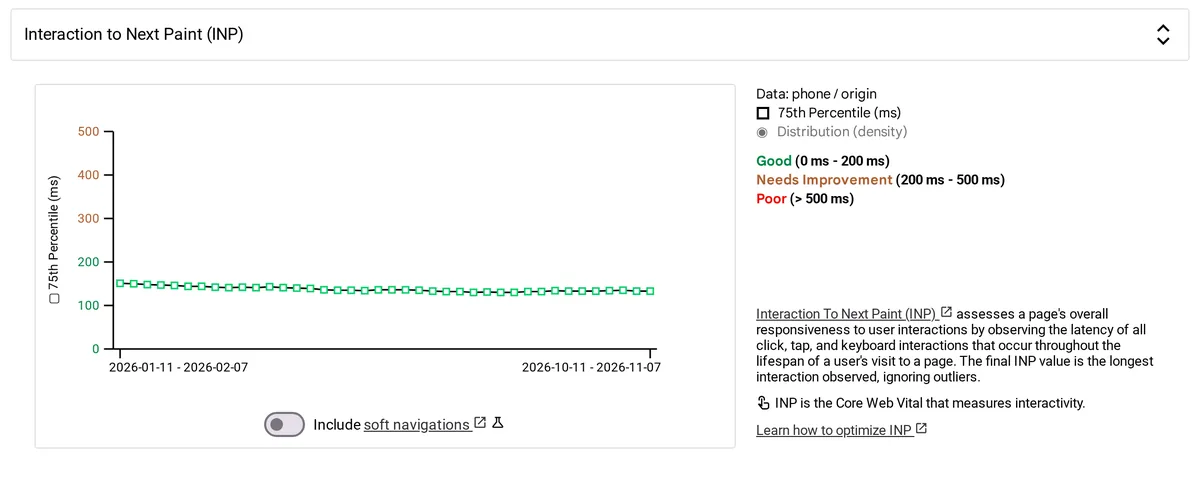
To see whether INP is getting better or worse over time, open CrUX Vis and switch to Interactivity. The chart below shows a real origin, wordpress.org, holding its phone INP inside the good band through 2026.
Do this if: INP is Needs improvement or Poor on mobile. Skip ahead if: only the lab report complains. Lighthouse never clicks, so it shows Total Blocking Time as a proxy, not INP.
Step 2: Find the slow interaction in Chrome DevTools
Field data tells you that a page is slow. DevTools tells you which click and why. Open the page in Chrome, press F12, and choose the Performance tab.
- In the capture settings, set CPU throttling to 4× slowdown. Your laptop is faster than your visitors’ phones; throttling makes the slow click show up.
- Reload the page and interact the way visitors do: open the mobile menu, expand an accordion, tap a tab, type in search.
- Watch the live INP card update after each interaction. The Interactions list shows which element was slowest.
- Click Record, repeat that one slow interaction, then stop the recording.
- Open Insights → INP breakdown. It zooms to the interaction and shows the three phases in milliseconds.
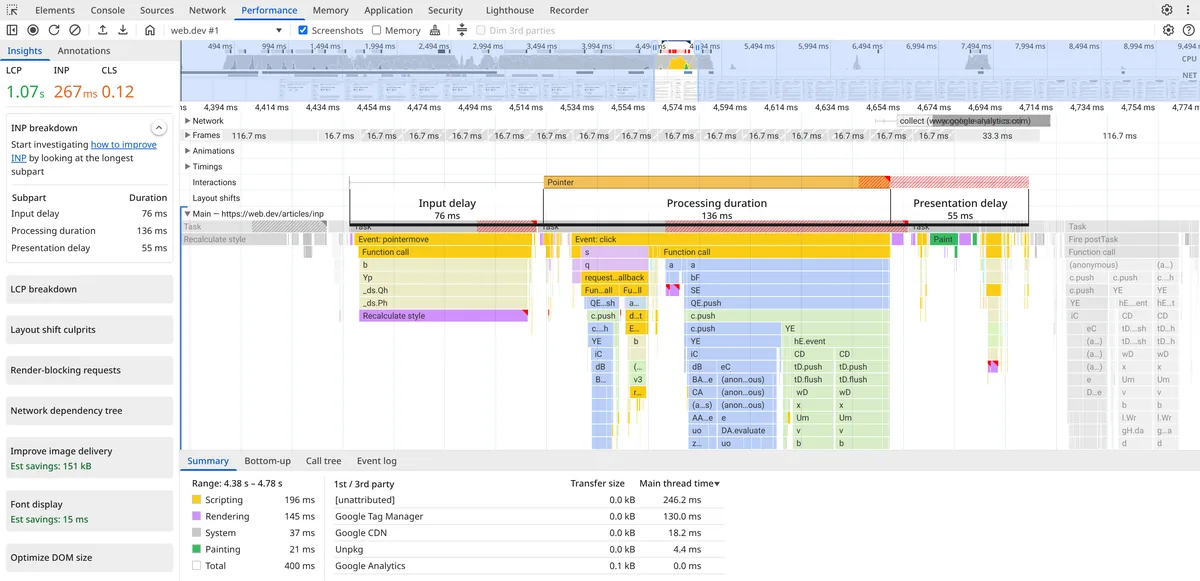
In that trace, processing is the biggest phase, and the Summary tab lists Google Tag Manager with 130 ms of main-thread time in the same window.
That shape is common on content sites: the page’s own code is light, and the tags are not.
| Biggest phase | Usual WordPress cause | Go to |
|---|---|---|
| Input delay | Scripts still loading or running when the visitor taps: chat, ads, tag managers, sliders | Step 3 and Step 4 |
| Processing duration | Heavy click handlers: analytics listeners, menu or popup scripts, jQuery plugins | Step 3 and Step 6 |
| Presentation delay | A deep DOM from nested builder sections, mega menus, large comment threads | Step 5 and Step 6 |
The catch: one recording on your laptop is a sample, not a verdict. Repeat the interaction three times and fix the phase that is consistently largest.
Step 3: Cut and delay third-party JavaScript
Third-party scripts are the cheapest INP win, because you rarely need them on every page or at load time. In your trace, the Summary and Bottom-up tabs show which third parties use the main thread.
Remove what nobody uses
Audit your tag manager container and header scripts. Old A/B tests, retired ad pixels and duplicate analytics tags cost main-thread time on every visit. Delete them before you optimise them.
Put chat and video behind a facade
A facade is a static placeholder that looks like the widget and loads the real script only when someone clicks it. Chrome’s Lighthouse documentation on third-party facades recommends the pattern for chat widgets and video embeds.
Chat is the usual offender. Our roundup of WordPress live chat plugins covers which widgets let you load chat only on pages where someone answers it.
For YouTube, the lazy load plugins that swap YouTube embeds for a preview thumbnail do the facade work for you.
Delay the rest until the first interaction
Performance plugins can hold scripts back until the visitor scrolls, moves the mouse or taps. Perfmatters calls it Delay JavaScript, with two modes: specified scripts or all scripts. Our Perfmatters review walks through its settings.
If you would rather keep one plugin, several options in our comparison of WordPress cache plugins include a delayed JavaScript setting alongside page caching.
⚠️ The catch: delaying everything moves the cost to the first tap. If the menu script is delayed, that tap loads every held-back script before the menu opens. Exclude menu, form and slider scripts; delay tags, chat and pixels.
Our pick: use “delay specified scripts” with a short list (analytics, tag manager, ad and social pixels) rather than “delay all”. It is less dramatic in a lab score and much safer for real INP.
Step 4: Load plugin scripts only where they are used
A form plugin that loads its JavaScript on every post adds parse and compile work to pages without a form. Unloading it there is how you reduce JavaScript in WordPress without losing features.
Script managers such as the one in Perfmatters let you switch a plugin’s assets off per page, post type or URL. Start with forms, sliders, galleries and pop-ups, then re-test the pages you changed.
If you build your own theme or plugin, WordPress 6.3 added a loading strategy to the Scripts API. The core dev note on async and defer in WordPress 6.3 documents a strategy argument:
add_action( 'wp_enqueue_scripts', function () {
	wp_enqueue_script(
		'my-menu',
		get_stylesheet_directory_uri() . '/js/menu.js',
		array(),
		'1.0.0',
		array(
			'in_footer' => true,
			'strategy'  => 'defer',
		)
	);
} );
Put code like this in a child theme’s functions.php, or in one of the WordPress code snippet plugins so it survives theme updates.
Common mistake: expecting defer to stick everywhere. Per the dev note, a script with an inline script attached after it stays blocking. So does a deferred script with a blocking dependent; WordPress protects execution order.
Skip it if: you only run third-party themes and plugins. Changing their registrations from outside is fragile; use a script manager instead.
Step 5: Fix INP on Elementor sites
Page builders add two INP costs: more JavaScript per page and a deeper DOM. Elementor has addressed both in core, so first make sure you are not running an old configuration.
- Improved Asset Loading: per Elementor’s help article on Improved Asset Loading, libraries such as the lightbox (about 20 KB), dialog (11 KB) and share links (3 KB) load only on pages that use them.
- Optimized DOM Output: Elementor removed several wrapper divs, and from version 3.19 that leaner markup is part of core rather than an option.
- Containers instead of sections and columns: a section needs a column inside it, a container does not, so the same layout produces fewer nested wrappers.
Then check the DOM. In the Console, run document.querySelectorAll('*').length. Lighthouse starts warning above 800 nodes and calls a DOM excessive above 1,400. Mega menus and nested tabs are the usual bloat.
Addons matter more than Elementor itself. Every extra widget pack adds handlers and styles, so prune the ones you no longer use; our guide to the best Elementor addons flags which suites let you disable unused widgets.
Elementor’s V4 editor outputs leaner atomic elements, explained in our Elementor V4 guide to atomic elements, classes and variables. Before switching an old site, follow our step-by-step Elementor V3 to V4 migration checklist on staging.
The catch: Element Caching speeds up server rendering and TTFB, not the browser’s main thread. It helps LCP; do not expect it to move INP.
Step 6: Break up long tasks in your own code
If the slow handler is your own code, the fix is to do less before the next paint. Any task over 50 ms counts as a long task and blocks input.
Update the screen first, then yield and do the rest in a new task. The web.dev guide to optimizing long tasks recommends scheduler.yield() with a fallback, because Safari does not support it yet:
function yieldToMain() {
	if ( globalThis.scheduler?.yield ) {
		return scheduler.yield();
	}
	return new Promise( ( resolve ) => setTimeout( resolve, 0 ) );
}

button.addEventListener( 'click', async () => {
	menu.classList.toggle( 'is-open' ); // visible change first
	await yieldToMain();
	sendAnalytics();                      // background work after the paint
} );
Yield after the visible change, never before it.
For presentation delay on long pages, content-visibility: auto lets the browser skip rendering off-screen sections until they near the viewport. Our guide to adding custom CSS in WordPress and Elementor shows where to put it.
Do this if: DevTools shows your theme or plugin file at the top of the processing bar. Skip it if: the time belongs to third parties; Step 3 is faster.
How do you check the INP fix worked?
- Lab check, same day: repeat the exact interaction in the DevTools Performance panel with the same 4× slowdown. The INP breakdown should show the phase you targeted shrinking.
- Functional check: open the menu, submit a form and play a video on mobile. A faster INP with a dead menu is not a fix.
- Field check, after 28 days: PageSpeed Insights uses a rolling 28-day window, so expect a gradual slide rather than an overnight change.
- Search Console: once field data looks good, open the failing issue in the Core Web Vitals report and click Validate fix.
Want real-user INP sooner? The open-source web-vitals library reports INP with attribution from your visitors. web.dev’s INP documentation explains why field data beats a lab trace for this metric.
What breaks and how to undo it
| Symptom | Likely cause | Fix |
|---|---|---|
| Mobile menu needs two taps | Menu script is delayed until interaction | Exclude the theme’s menu script from delay |
| Form will not submit or captcha missing | Form or captcha script unloaded or delayed | Re-enable the form plugin’s assets on that page; exclude its script |
| Analytics sessions drop | Tag manager delayed with no timeout | Enable the plugin’s delay timeout, or accept that bounced bots disappear |
| Slider or gallery shows unstyled | Swiper or lightbox script unloaded on a page that uses it | Remove that page from the script manager rule |
| INP worse after enabling delay all | Every held-back script runs on the first tap | Switch to delaying specified scripts only |
To undo, change one setting at a time and keep a note of what you changed. Turning off the last change is faster than restoring a backup, and it tells you exactly which script mattered.
Frequently Asked Questions
What is a good INP score for WordPress?
A good INP is 200 milliseconds or less at the 75th percentile of real visits. Between 200 and 500 ms needs improvement, and above 500 ms is poor. Google measures mobile and desktop separately, so check mobile first, where slower phones expose long tasks.
Why does PageSpeed Insights not show an INP value?
INP needs real interactions from Chrome users. If a page or origin has too little traffic, CrUX has no INP data. Lighthouse lab tests load the page without clicking, so they show Total Blocking Time instead. Use DevTools to measure INP yourself.
Does a caching plugin fix INP?
Page caching mainly improves server response time and LCP. INP depends on JavaScript running in the browser after the page loads. A cache plugin helps INP only through extra features such as delaying or deferring JavaScript, not through the cache itself.
Does delaying JavaScript always improve INP?
No. Delaying scripts frees the main thread during load, but the delayed scripts all run on the first interaction. If a menu or form script is delayed, that first tap can get slower. Delay tags and chat, and exclude interactive scripts.
How do I reduce INP on an Elementor site?
Keep Improved Asset Loading on, build with Flexbox containers instead of nested sections, remove unused addon packs and watch the DOM size. Then delay third-party tags. Element Caching helps server time, not INP, so do not rely on it for responsiveness.
What replaced First Input Delay?
Interaction to Next Paint replaced First Input Delay as a Core Web Vital on 12 March 2024. FID only measured the input delay of the first interaction. INP measures every click, tap and key press through the whole visit, including processing and painting time.
How long does it take for INP improvements to show in Search Console?
Field data in PageSpeed Insights and Search Console covers a rolling 28-day window. Improvements appear gradually as old visits drop out. After the numbers look good, use Validate fix in the Core Web Vitals report to start Google’s check.
Can a live chat widget hurt INP?
Yes. Chat widgets load sizeable third-party JavaScript and often run timers and listeners on the main thread. Load chat only on pages where someone answers it, or use a facade that loads the real widget when a visitor clicks the chat button.
Which INP fix should you do first?
- Start with Step 3 if: DevTools shows chat, tag manager, ad or pixel scripts in the slow interaction. That is most content sites, and the fix takes an afternoon.
- Start with Step 4 if: one plugin’s script shows up on pages that never use it, such as a form or slider on every post.
- Start with Step 5 if: presentation delay is the largest phase and the page is built with a page builder.
- Leave it alone if: field INP is good on mobile and desktop. Chasing a lab number past that point costs time and can break interactions.
Our pick for most StyleMyWP readers: trace one slow tap in DevTools, delay the third-party tags it reveals, unload one unused plugin script, and re-measure. That order starts with the cheapest fixes and leaves theme code for last.
Last updated November 2026.